Timepix GUI
Contents
Tpx3 Acquisition App using PymePix
PymePix[1] is a Python library developed to simplify the process of interfacing with the Timepix event-based cameras. Our lab uses the Tpx3 camera to measure the time-of-flight of dissociated ions accelerated in a vaccuum chamber. I implemented PymePix and PyQT5 to create a visual data acquisition program tailored to our lab. The program allows one to connect to a Tpx3 camera and view/save real-time incoming data, or visualize previously saved data with more options.
Connection and Acquisition
Under the first two tabs in the GUI, one can connect to a camera at a specific IP and port and work with live data from the camera. The program can be configured to show any combination of pixel data, centroided data, or a time of flight spectrum. One can also view basic information about the incoming data such as the mean detections per laser pulse and the total number of centroid points displayed on the plots at a given time.
This section also provides saving options for centroided data, such as setting the save directory, optionally presetting an acquisition time, and appending a timestamp to the filename.
These options allow for quick diagnosis of potential experimental issues before and during acquisition without any additional steps, combined with the ability to quickly start and stop acquisition once issues are resolved.
Data Analysis and Visualization
The other main function of the application is to provide some further analysis and visualization options for saved data. One can load in previously saved data to see the time of flight spectrum, centroid histogram, and statistics as before, but there are more options for manipulating it.
This tab comes with a tool to transform the x-axis of the time of flight spectrum to mass as long as one can identify two peaks corresponding to known species. One can also specify a subset of the spectrum and view the histogram that corresponds to only this section. This can be very useful for isolating features that are difficult to see in the fullly integrated histogram, and the statistics are updated to only reflect this region.
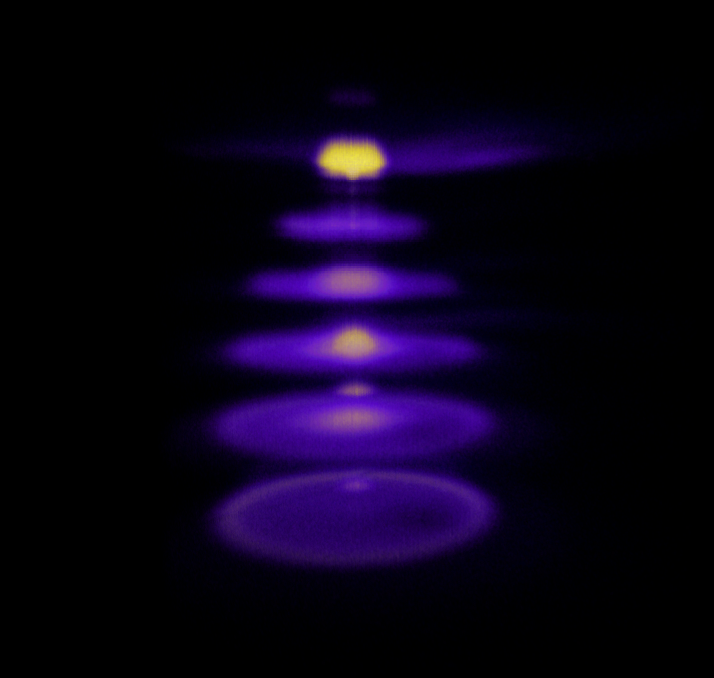
The application also provides a "3D mode" for the histogram. This expands the plot with a third axis representing the time of flight. This allows one to see the clusters and rings associated with different dissociation events clearly in one plot. The colors and transparency settings can be adjusted based on the amount of data and the features of interest. The time of flight subset can also be applied to this plot.
These options allow for more detailed viewing of data and comparison between different datasets, while still being quick and integrated into the same application. Using this tab also does not require one to have an active connection to the camera, so it can be used from anywhere.
Bibliography
1. "PymePix: a python library for SPIDR readout of Timepix3"
A. Al-Refaie, M. Johny, J. Correa, D. Pennicard, P. Svihra, A. Nomerotski, S. Trippel, J. Küpper
Journal of Instrumentation 14, P10003–P10003 (2019)

Student Biography
My name is Kovi Bodek, and I'm an undergraduate at Stony Brook University. I'm majoring in physics and psychology, and doing a minor in music theory. After graduation, I am looking forward to continuing my education in physics.
I've been working with the group for most of the last year and have been lucky to be able to apply my knowledge of programming and data analysis to exciting problems in optics such as machine learning reconstruction of dispersion scans and covariance analysis of dissociation events.
In my free time I enjoy writing music, performing with my band, and creating art with code.